Networking the Early Video Game Industry
Introduction
The video game industry in the United States, despite being quite a young technological field, has had an active and tumultuous career, especially when US developers were the predominant force worldwide for video games. However, despite the successful nature that the industry had, it was not without its issues. In the United States, the video game industry has long been known as a “boys’ club” with limited access for non-whites and women. From the early 1960s to the mid-1980s, majority of the known video game developers were, in fact, white middle-class men.
During this time, the great majority of these developers had been involved in some sort of computer science university programs. These programs, especially for the 1960s and 1970s, were not especially diverse, and women were actively discouraged from using “masculine” high-end technologies such as computers.
Since many of these game developers found inspiration, or even directly lifting the code, within each other’s work, this created a network of game developers and the video games that they developed. Given this, it would be interesting to create a network analysis of a selection of video games and their known developers in order to see what kind of connections and inspirations took place from the late 1950s into the mid-1980s.
Beyond just the network analysis, which will provide useful data, it may also be useful to try a few other techniques of plotting the data to see what kind of conclusions can be gained from this methodology. The files that I used for this project can be found on my Github.
Methodology
It should be noted that this is a project for a class entitled “Programming for Historians.” Historians, at least good ones, let the sources lead them to their conclusions. After reading through the sources, we can make a thesis on how things have changed over time in our particuar fields of interest. So, what happens when we engage these historical sources with programming methodology? Potentially, the programming historian will be able to see things they had not seen previously or connect things in a new way.
After writing my master’s level thesis and engaging in new research, I ended up with a set of data that could potentially be utilized in traditional, historical scholarship. However, given my interests in digital history, it made sense to try my hand as a programming historian to see where the sources could potentially lead.
All of the following plots and graphs were created using R and RStudio.
On Data
For this project, it was important to consider utilizing the types of data for my network analysis. Using a list of video games, developers, and dates that I created during the research process, I was able to create a document for use in this project. One of the issues that arose was the lack of credit for developers in the early video game industry. With the lack of credit, there are a lot of video games without listed creators. This led to the methodology question of whether to include games without credited authors, as this would limit the networks of people, while making the networks of games quite a bit larger.
This list was also included in another CSV file in order to demonstrate the formats the games came on, the year of their release, the origin of the developer, and the genre of game. This allowed for further analyses on these games beyond just the networking plots.
Analysis
The following images are the different plots. From these, several conclusions can be made that might not have been possible otherwise.

What is most interesting about this graph is that, upon viewing it, it became immediately clear that there was a huge influence from Space War! (1962) in early gaming. Interestingly, Pong did not have as much direct influence as I had thought it would have, and there were a lot more original concept games, which is the upper node. Although I was familiar with the idea that Space War! was influential in the early industry, it was not as clear to me when looking at the sources previously how influential it was. More interestingly, however, is the idea that there were many original games. Going into this project, I had the notion that many of the games in the early industry were derivatives of other games, which inspired this network analysis in the first place. This plot shows that there were a lot more original ideas than I initially thought during the early years of the industry.

This network plot actually demonstrates the development teams. The nodes represent the games that were developed, with the edges serving as the developers themselves. From this, we can see that although there were some development teams that had multiple members or a single developer that created multiple games, it seems that the developers in the early industry (that were known) mostly worked alone and created a single game. Again, this information could have been gathered by individually looking at the games and developers, but it was not as readily apparent without using this methodology.

This graph shows the same information, but it uses the developers’ names as the edges and the games as the nodes. This gives us the exact same networks, but I felt it was important to demonstrate it in both ways.

Using the second CSV file, I was also able to graph the genres of the games, showing the amounts of each type from 1958-1986. We see here that space games are the most popular type during the period, which we could have guessed from the network graph from the top. However, it is also quite interesting to see the range of genres. For example, I never would have guessed that the number of x-rated games equaled the sports games during the time.
1 2 3 4 5 6 7 8 9 |
Type Type_Count 1 space 15 2 puzzle 10 3 adaptation 9 4 sport 9 5 x-rated 9 6 conflict 8 7 fantasy 6 8 platforming 6 |

This graph is a representation of the release years of the games from 1958-1986. As one would think, the amount of games that are released throughout the period increases in the late 1970s and early 1980s. What is most significant about this graph is the peak of game releases in 1982. In 1982, Atari had a difficult time with quality control over what games came out for their console, which led to an increase in poorly made games and x-rated games. This led to the video game crash of 1982, which the US industry did not recover from until the 1986 release of the Nintendo Entertainment System.
For further reference, I was able to create a list in R of how many games were released each year.
1 2 3 4 5 6 7 8 9 10 11 12 13 14 15 16 17 18 |
Year Games_Per_Year 1 1958 1 2 1962 1 3 1971 1 4 1972 1 5 1973 1 6 1977 1 7 1974 2 8 1975 2 9 1976 2 10 1978 2 11 1984 2 12 1986 2 13 1979 6 14 1980 6 15 1983 7 16 1981 11 17 1982 24 |
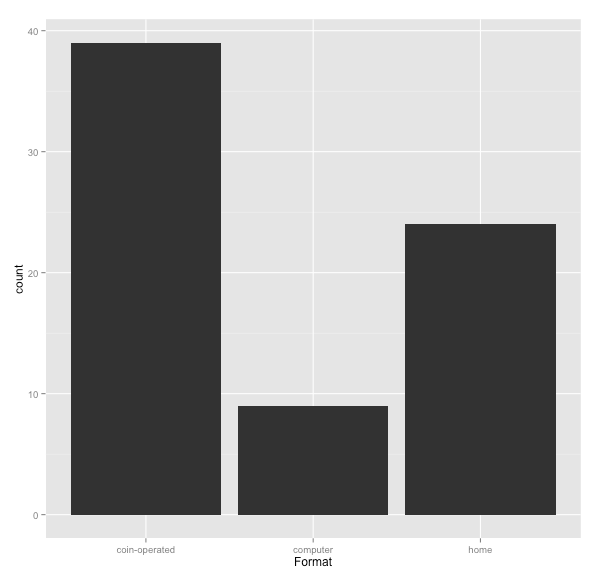
In this graph, it shows the format of releases during the time period. Given the three types of formats at the time–computer, home, and coin-operated–we can see that coin-operated and home were much more popular. Coin-operated games were the most successful types of games, and many of the coin-operated games were later ported onto home consoles. Physical arcades were still the most dominant space for gaming at the time.

This last network graph demonstrates which “communities” could be located through plotting in R. It is a combination of the developers and their games that they created, which makes it a little clearer what teams existed or who created multiple games.
Conclusions
One of my major conclusions from this project, although not necessarily having to do with the data, is that programming for analysis can help historians draw conclusions that may not be the most obvious from reading the sources. Being able to use many different types of programming (graphs, network plotting, maps, text analysis, etc), and even the failures of some of these methods to produce anything meaningful, can lead to some very important interpretations.
For example, going into this project, I had a clear opinion that many of the early video games up to the middle of the 1980s were derivative, especially from Space War!. However, after utilizing the network analysis through R, I was able to conclude that while many games were influenced and inspired by Space War!, there were also a significant amount of original games that came out of the period as well. This is very different than the conclusions that I thought would occur upon starting this project, and part of this was due to the fact that I expanded the data set that I started with to include any game with a known developer at the time, rather than just games that were known to have derived from a game. Thinking about the sources and how the data could be used was extremely helpful to me, and as a historian should, I allowed the sources to lead me to the conclusions, despite the fact that they were different than what I had originally thought they would be.
In terms of the data, I believe that it is important to note that the industry was largely slow to gain momentum until the late 1970s and early 1980s, but then it experienced its crash in 1982. The US-dominated video game industry itself was very short lived, despite its beginnings in 1958. Commercially, it didn’t even begin until Computer Space was released in 1971, with it actually becoming viable in 1972 with the release of Pong. Due to the lack of quality control, the large amount of x-rated and poor games (which, I did not realize going into this project that there were such a significant amount of x-rated games in comparison to some of the other genres, such as puzzling games) led to the crash of 1982.
These plots and graphs have actually brought up further questions for analysis. Why did these developers, mostly men, work alone? When they didn’t work alone, what was the reason for the teams? What did they work on after they finished their game development? Did they continue their programming or get into another field altogether? What were women doing at this point, besides the two that appear in the plots? What did those two women go on to do? Further analysis into the topic may answer some of these research questions that emerged from the programming work.
Bibliography
Primary Sources
Baer, Ralph “Genesis: How the Home Video Games Industry Began.” Ralph Baer Consultants. Last modified 2010. http://www.ralphbaer.com/how_video_games.htm. Accessed October 20, 2014.
Davis, Warren. “The Creation of Q*Bert.” Last modified 2013. http://www.coinop.org/features/qbstory.aspx. Accessed October 20, 2014.
Electronic Games. Winter 1981-March 1985.
Eimbinder, Jerry and Eric Eimbinder. “Electronic Games: Space-Age Leisure Activity.” Popular Electronics. October 1980. 53-59.
Graetz, J. M “The Origin of Spacewar.” Creating Computing. August 1981. 56-67.
Haddon, Leslie. “Electronic and Computer Games: The History of an Interactive Medium.” Screen, Spring 1988. 52-73.
Joystik Magazine. September 1982-December 1983.
Levy, Steven. Hackers: Heroes of the Computer Revolution. New York, New York: Dell Publishing, 1984.
Video and Computer Gaming Illustrated. October 1982-March 1984.
Video Games Magazine. March 1983.
Secondary Sources
Donovan, Tristan. Replay: The History of Video Games. East Sussex, England: Yellow Ant, 2010.
Herman, Leonard. Phoenix: The Fall and Rise of Video Games. Union, New Jersey: Rolenta Press, 1994.
Kent, Steven L. The Ultimate History of Video Games: From PONG to Pokemon and Beyond— The Story Behind the Craze That Touched Our Lives and Changed the World. New York, New York: Three Rivers Press, 2001.
Wolf, Mark J.P., ed. The Medium of the Video Game. Austin, Texas: University of Texas Press, 2001.
Wolf, Mark J.P., ed. The Video Game Explosion: A History from PONG to Playstation and Beyond. Westport, Connecticut: Greenwood Press, 2008.